This past week, interest rates held steady in what was a short week with little economic news. Let’s break down what happened and what to keep an eye on in the weeks ahead.
“Turn and face the strange. Ch-ch-changes.” – David Bowie
The Inauguration and Fiscal Policy Changes
The big event last week was the swearing-in of our 47th president, Donald J. Trump. A new president always brings changes, especially in fiscal policy. Now, the markets are closely watching to see how these potential shifts will impact the economy.
What is Fiscal Policy?
It’s essentially how the government uses spending and taxes to steer the economy.
Goals of Fiscal Policy:
- Promote economic growth: Spending on things like roads, schools, or healthcare can create jobs and boost business activity.
- Control inflation: By cutting spending or raising taxes, the government can cool down an overheated economy.
- Reduce unemployment: Targeted programs and infrastructure projects can help create jobs.
Types of Fiscal Policy:
- Expansionary: Used in a struggling economy (like during a recession) by increasing spending or cutting taxes to encourage spending.
- Contractionary: Used in a booming economy with high inflation by cutting spending or raising taxes to slow things down.
The tricky part? Balancing the need to support struggling sectors (like housing and manufacturing) with keeping inflation in check. And with high deficit spending, selling more debt (bonds) could rattle the bond markets.
Signs of Disinflation
We’ve seen some promising signs of disinflation recently (slower inflation, not deflation). Inflation has dropped from 9% in 2022 to just above 3% annually.
What’s driving this?
- Higher rental vacancies: If this continues, it could help lower inflation since shelter costs carry a lot of weight in inflation data.
- Energy prices: Falling energy costs could also play a significant role in keeping inflation on the downswing.
30-Year Mortgage Rates
- The average 30-year fixed rate dropped slightly to 6.96% as of January 23, 2025 (down from 7.04% last week).
- This time last year, the average was 6.69%.
10-Year Treasury Yield
The 10-year Note yield, which moves closely with mortgage rates, has continued to decline. It’s down from the 2024 highs above 4.80% to around 4.50%.
Bottom Line
The last couple of times rates were at these levels, they improved soon after. Softer inflation data might have sparked this recent improvement, but upcoming fiscal policy changes will play a big role in determining whether inflation keeps cooling or stays elevated.
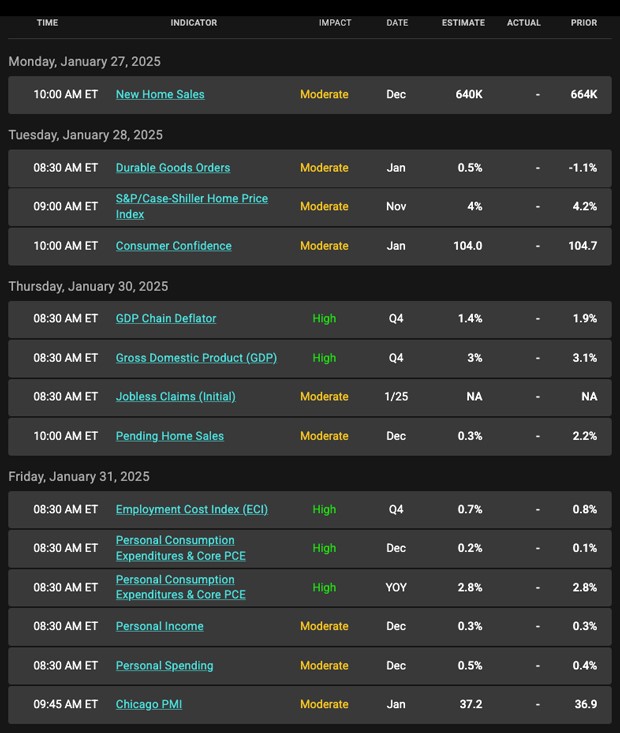
Looking Ahead
Next week is a big one:
- Fed Meeting: While no rate cut is expected, markets will be looking for clues on how the Fed plans to respond to fiscal policy shifts.
- Key Reports: We’ll see important updates like the Fed’s preferred inflation gauge, the Core Personal Consumption Expenditures (PCE) Index, and GDP for Q4 2024. While GDP is backward-looking, it helps paint a clearer picture of where the economy is heading as we dive into 2025.
Stay tuned—there’s a lot to watch!
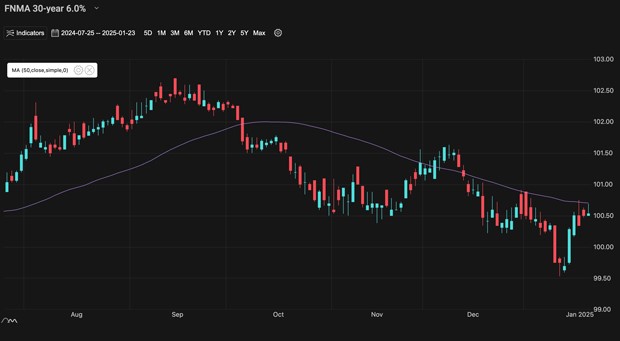
Mortgage Market Guide Candlestick Chart
Mortgage bond prices determine home loan rates. The chart below is a one-year view of the Fannie Mae 30-year 6.0% coupon, where currently closed loans are being packaged. As prices move higher, rates decline, and vice versa.
If you look at the right side of the chart, you can see the recent rebound higher in prices (lower in rate) is being challenged by a ceiling of resistance which will act to halt any further rate/price improvement.
Chart: Fannie Mae 30-Year 6.0% Coupon (Friday, January 24, 2025)
Economic Calendar for the Week of January 27 – 31