A Look into the Markets
Home loan rates held steady near the best levels in months after another decline in inflation. Let’s look at what happened this week and brace for what is coming in the week ahead.
“Pump it up, Until you Can Feel it, Pump it Up, When you Don’t Really need it” – Pump it Up by Elvis Costello.
December Consumer Price Index (CPI)
The headline Consumer Price Index, which includes food and energy prices, came in -0.1% for the month of December, which lowered the annual rate to 6.5%. The month-over-month decline was the first negative reading since December 2020.
Inflation is a main driver of long-term rates and is closely watched by the Fed, so seeing prices decline was a welcome sign for both.
The markets agreed. After the CPI report was released, the probability of a .25% rate hike on February 1st spiked to 87%. So, the markets are now expecting smaller and less Fed rate hikes.
Markets Are Forward Looking
The 10-yr Note yield, which does ebb and flow alongside mortgage rates, touched 3.46% after the report, the lowest level since early December. Long-term rates are forward looking and seeing where inflation is headed, which is lower. If inflation continues to decline, we should expect long-term rates like the 10-yr Note and mortgages, to decline as well.
Fed Jawboning Not Working Like 2022
Last year, home loan rates spiked higher and quickly in response to tough Fed talk or jawboning. So far this year, tough Fed talk is not having the same effect. Even though the Fed is currently saying they will keep rates higher for longer, long-term rates have ignored their words and continued to improve.
This is a reminder that long-term rates will only go higher if the economy can absorb all the rate hikes. The Treasury market is clearly saying the economy can’t handle higher for longer rates without tipping into an economic recession. Like the famed investor, Jeffrey Gundlach, shared this week, “Watch Treasuries to follow Fed rate hikes and do not listen to the Fed”.
Bottom line: 2023 has started with an improvement in rates, which is the opposite of what happened last year. With sellers eager to make deals, now is a great time for a buyer.
Looking Ahead
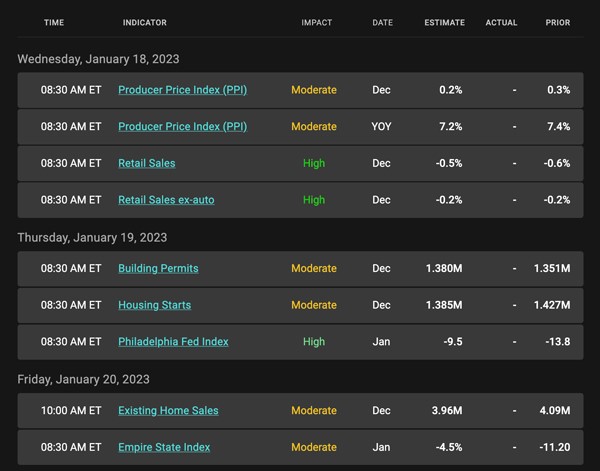
Next week is filled with economic reports that could move the markets, including Producer prices, housing, and retail sales. The good news is it feels like the markets are close to fully pricing in a .25% Fed rate hike in February, which could remove some volatility.
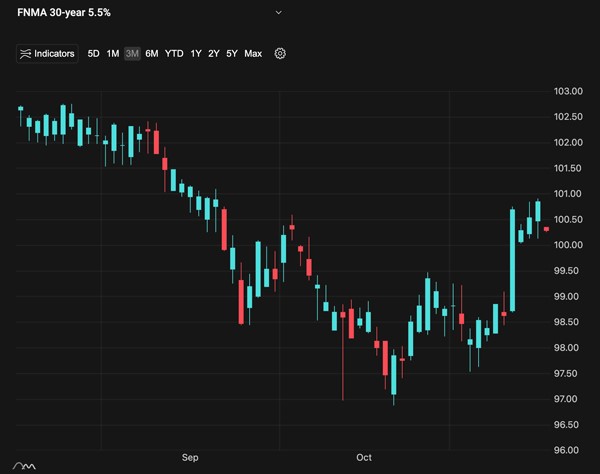
Mortgage Market Guide Candlestick Chart
Mortgage-backed security (MBS) prices determine home loan rates. The chart below is a one-year view of the Fannie Mae 30-year 5.5% coupon, where currently closed loans are being packaged. As prices go higher, rates move lower and vice versa.
MBS prices are right at a ceiling of resistance, which is limiting further improvement in rates. If MBS can move just slightly higher and above this nearby ceiling, rates will likely improve a bit more. The opposite is true.
Chart: Fannie Mae Mortgage Bond (Friday January 13, 2023)
Economic Calendar for the Week of January 16 – 20
A Look into the Markets
This week, interest rates touched the lowest levels in two months on the idea that inflation may have peaked. Let’s break down what happened and look into Thanksgiving Week.
“Well I’m going down. Down, down, down, down, down” Going Down by Jeff Back
10-yr Note Touches 3.67%
The 10-yr Note yield touched 3.67% this week, a large rate improvement from 4.23% seen the previous week. The downtick in long-term rates also fed into home loan rates, which have declined as much as .50% in the last week or so.
The big question? Does this decline in rates have “legs” and will it continue?
Peak Inflation Equals Peak Rates
The readings on inflation suggest that we may have just seen the peak in inflation. We will want to see future inflation readings to confirm this, but long-term bonds, which are forward-looking, appear to be pricing at a peak.
Do not tell the Federal Reserve that inflation may have peaked. There were several Fed speakers out this week saying that inflation is still a problem, and they want to keep rates higher for longer.
Short-Term – Higher for Longer
Remember, when the Federal Reserve says they want rates higher for longer, they are talking about the Federal Funds Rate, which is an overnight rate that banks lend to each other. The Federal Funds Rate affects short term loans like credit cards autos and home equity lines of credit.
It is important to note that while the Fed Funds rate may increase by another 1.25% between now and next May, long-term rates like the 10-yr Note and mortgages, may have already peaked.
Smaller December Hike
The financial markets are now pricing in a high probability the Federal Reserve will only raise rates by .50% next month. Additionally, the markets are also sensing the Terminal Rate, or peak in the Fed Funds Rate will be 5 to 5.25% achieved by May of 2023. The Fed will attempt to lift rates that high and keep them there if the economic readings will support it.
Should we see the labor market struggle and inflation come down even further, the Fed may be forced to do less hikes. As the old saying goes, time will tell.
Bottom line: Home loan rates have improved. With more inventory coming to market and many sellers eager to make deals, now could be a great time to consider taking advantage of the opportunities in housing.
Looking Ahead
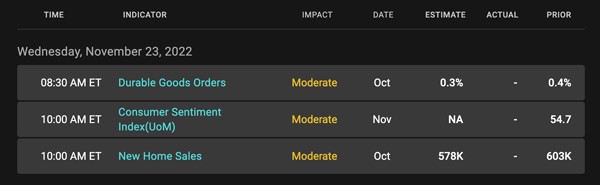
Next week we celebrate Thanksgiving, which means bonds are closed Thursday and only open a half day on Friday. There is also little in the way of economic data, with just Durable Goods Orders and Consumer Sentiment on Wednesday. There will be plenty of Fed speakers out to remind us of the need to hike rates more.
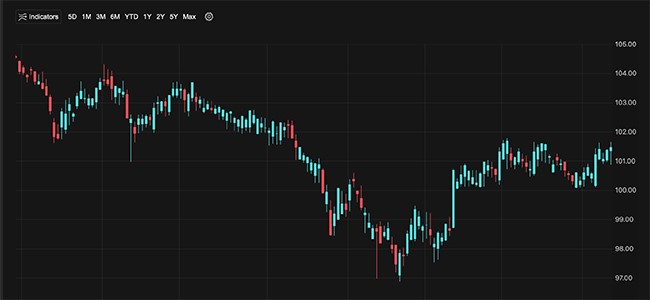
Mortgage Market Guide Candlestick Chart
Mortgage-backed security (MBS) prices determine home loan rates. The chart below is a one-year view of the Fannie Mae 30-year 5.5% coupon, where currently closed loans are being packaged. As prices go higher, rates move lower and vice versa.
You can see on the right side of the chart the Green Candles moving higher means a nice improvement in rates. For rates to improve further, we need to see MBS climb above $101, which will serve as a ceiling of resistance.
Chart: Fannie Mae Mortgage Bond (Friday Nov 18, 2022)
Economic Calendar for the Week of November 21 – 25