

Interest rates are still hanging out just below the best levels we’ve seen this year, which is awesome news. This past week, we got a key inflation reading, and the bond market finally got a breather. Let’s dive into what went down and what’s on the radar for next week.
“I’m going to Jackson; I’m going to mess around”…Jackson by Johnny Cash and June Carter
Inflation Cooling
Good news! The July Consumer Price Index (CPI) came in with a year-over-year number of 2.9%, the lowest since March 2021. When you take out food and energy, the Core CPI was 3.2%, also the lowest since April 2021. This is a big win for the bond market because, as we all know, bonds can’t stand inflation. This could even push the Fed to cut rates at the September meeting, maybe by as much as 0.50%.
Gimme Shelter
Shelter is a big player in the inflation numbers. It makes up a huge chunk—90% of the 2.9% CPI figure and 70% of the Core CPI figure.
What is Included in Shelter?
The shelter part of the CPI covers:
- Rent of Primary Residence: What people are actually paying for rent.
- Owners’ Equivalent Rent (OER): A rough estimate of what homeowners would pay if they rented out their homes. It’s hypothetical but based on real rental values.
- Lodging Away from Home: Think hotel stays and other temporary housing.
How is Shelter Computed?
- Data Collection: The Bureau of Labor Statistics (BLS) gathers rent and OER data from thousands of households across the country.
- Rent Index Calculation:
- For Rent: They track how rent prices change over time for various rental properties.
- For OER: They ask homeowners what they think their home would rent for and use data from similar rentals.
- Weighting and Averaging:
- Different types of housing have different weights in the shelter component, based on how much people spend on each type.
- The BLS creates an index for each type and factors in regional differences.
- Price Change Calculation: They calculate the average change in prices over time for all the shelter components.
- Aggregation: Finally, they put it all together to get the shelter component of the CPI.
Importance of Owners’ Equivalent Rent
- Why OER? Most people own their homes, not rent. Using only actual rents wouldn’t accurately reflect what most people experience.
- How OER is Estimated: It’s based on the idea that homeowners could rent out their homes and earn money, which is their opportunity cost.
Example:
Imagine the BLS finds that rent for a typical two-bedroom apartment went up from $1,000 to $1,050 over a year. At the same time, OER for a similar property increased from $1,200 to $1,250. They’d calculate the percentage change in both rent and OER and then combine them to see how shelter costs are changing overall.
Why Shelter is Important in CPI
Shelter costs are a big part of most people’s budgets and a significant chunk of the CPI. So, changes here can really impact the overall CPI and influence everything from economic policy to wage negotiations.
3.80%
The 10-year Note, which moves alongside home loan rates, was hanging around 3.80% late last week—pretty close to the lowest levels we’ve seen all year. The lowest so far in 2024 was 3.66%.
Refinance Activity Soaring
Lower home loan rates have done more than just spike purchase activity. Refinances jumped to 35% this week, as people are eager to lock in those low 2024 rates.
Bottom line: Rates are gradually getting better as the economy slows, inflation drops, and the unemployment rate edges higher.
Looking Ahead
Next week might seem quiet, but there are a couple of big things to watch. On Wednesday, the Minutes from the last Fed Meeting will drop. This was the meeting where they decided not to cut rates, just hours before the weak July Jobs Report sparked recession fears and talk of a possible 0.50% cut next month. Then, on Friday, Fed Chair Jerome Powell will speak at the Jackson Hole Symposium. This gathering has a history of shaking up the market, so stay tuned!
Economic Calendar
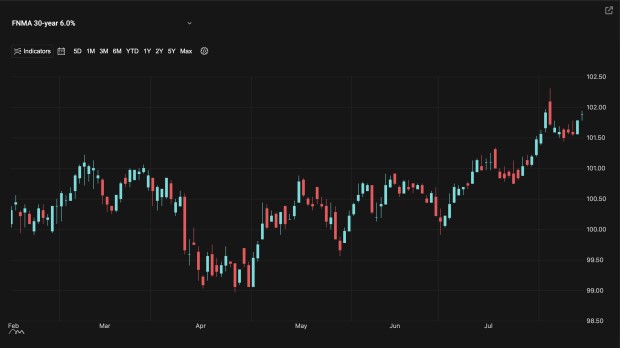
Mortgage bond prices determine home loan rates. The chart below is a one-year view of the Fannie Mae 30-year 6.0% coupon, where currently closed loans are being packaged. As prices move higher, rates decline, and vice versa.
If you look at the right side of the chart, you can see how prices are just below the best levels of the year.
Chart: Fannie Mae Mortgage Bond (Friday August 16, 2024)
Economic Calendar for the Week of August 19 – 23


