This Past Week: Interest Rates Improve Amid Inflation Data
This past week, interest rates improved from the highest levels of the year in response to inflation data. Let’s talk about what happened and review what to watch in the week ahead.
“My, my, my, I’m so happy, I’m gonna join the band. We’ gonna dance and sing in celebration, We are in the promised land” – Celebration Day by Led Zeppelin.
Consumer Prices Lower Than Expected
The Federal Reserve has a dual mandate given to them by Congress:
- To promote maximum employment.
- Maintain price stability.
This past week, the markets directed their attention toward the price stability (inflation) portion of the Fed’s mandate. Important inflation readings at the producer and consumer level were reported. Overall, inflation came in lower than expected as prices disinflated from November to December. That is welcome news.
The Core CPI (Consumer Price Index), which excludes food and energy and is more closely watched by the markets, showed a surprising decline. Heading into the release, the markets had been on edge due to fears of inflation re-accelerating. So, as the title of this week’s newsletter states, the market experienced “jubilation” upon lower inflation.
It is important to note that this is one inflation reading, and the economy is not out of the woods as it relates to higher or sticky inflation. Additionally, this reading is from December, so it is backward-looking. Since that time, oil prices have spiked sharply, now standing at nearly $80 a barrel. This means it would not be a surprise to see headline inflation creep higher or not come down in next month’s reading.
A positive sign within the report that could bode well for inflation in the future is shelter. Shelter makes up an outsized portion of consumer price inflation, and that number has retreated. If that trend continues, it will help inflation ease back down to the Fed’s goal of 2% over time.
The Fed’s Preferred Inflation Gauge Is Coming
The Fed’s more favored gauge of inflation, the Core Personal Consumption Expenditure (PCE) Index, will be reported in a couple of weeks. This reading runs lower than CPI as it has a different methodology. Here’s what the Cleveland Fed has shared on the differences between CPI and PCE:
- Different weights: Weights reflect the proportion of consumers’ total spending on an item. Many weights in the CPI and PCE price index are similar, such as those for food. But many other weights are different.
Two big differences are for healthcare and shelter:
- PCE: 16% healthcare and 16% housing.
- CPI: 4% healthcare and 32% housing.
If future inflation readings come in lower still, we could see the Federal Reserve cut rates this year more than the one cut currently expected.
30-Year Mortgage Rates
- 30-Year Fixed Rate: 7.04% (as of January 16, 2025), up slightly from the previous week when it averaged 6.93%. A year ago at this time, it was 6.60%.
10-Year Note Yield: 4.65%
The 10-yr Note yield, which ebbs and flows with mortgage rates, declined nicely from the 2024 highs above 4.80%, backing down to the 4.65% level. The 4.65% has provided some “yield resistance” as rates were rising, so that will now act as “yield support,” potentially slowing the improvement in rates.
Bottom Line
The previous two times rates were at these levels, they improved nicely. The softer inflation numbers may have been the spark to help rates improve this time around as well.
Looking Ahead
We are now in the Fed’s blackout or “quiet period,” where no Fed officials comment or speak about monetary policy until Friday, January 31 – two days after the next Fed Meeting.
Other notable events:
- President-Elect Trump: Sworn in as the 47th President on Monday.
- Martin Luther King Jr. Day: Observed Monday, January 20. Markets will be closed.
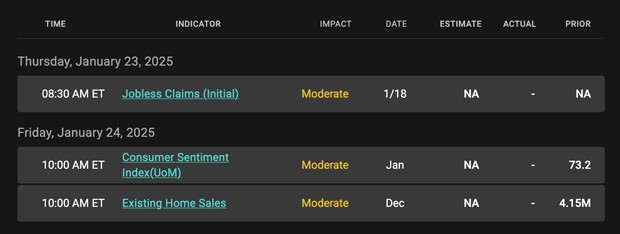
- Economic Calendar: Light this week. Watching key levels and charts in the absence of news will be important.
Let’s stay in touch – reach out with any questions or insights!
Mortgage Market Guide Candlestick Chart
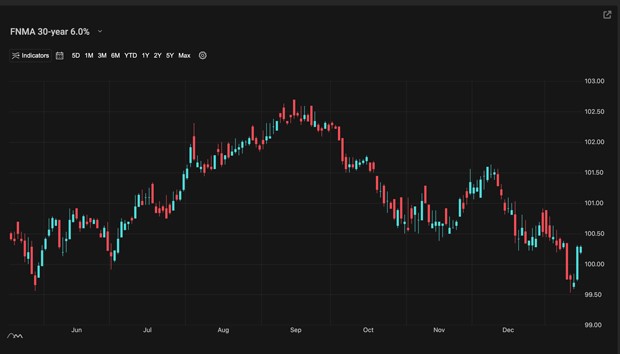
Mortgage bond prices determine home loan rates. The chart below is a one-year view of the Fannie Mae 30-year 6.0% coupon, where currently closed loans are being packaged. As prices move higher, rates decline, and vice versa.
If you look at the right side of the chart, you can see how prices have declined to the lowest levels since July 4th, meaning these are the highest mortgage rates since July.
You can also see the “levees” or ceilings of resistance (yellow lines) which are preventing prices from moving higher and rates moving lower.
Chart: Fannie Mae 30-Year 6.0% Coupon (Friday, January 10, 2024)
Economic Calendar for the Week of January 20 – 24